SPMA: Standardized Procedures of Mortality Analysis
The SPMA web application allows scientific researchers and public health policy makers to conduct their own analysis of Belgian vital statistics (population, birth and death statistics) by year in an interactive and user-friendly way. Specific analyses about life expectancy, health expectancy, mortality, and causes of death are available on the ‘Health Status Report’ website.
How to use SPMA
SPMA acts as an interface between the population, birth and mortality data on the one hand and the Internet module of the statistical software package SAS® (Stored Process on SAS BI) on the other hand. The user chooses the necessary parameters on the interactive web page which will then be analysed by the SAS system. The generated results will be displayed as HTML tables, graphs and maps.
Procedure
The statistics of SPMA are classified in 5 main chapters (plus a link to the health expectancy tool). Each of these chapters is subdivided in the sections ‘By year’ and ‘Evolution over time’. The chapter on “Cause-specific mortality” contains an additional section on the ‘Ranking of causes (by year)’.
Clicking on a section will connect you with the interactive web page. Pre-defined statistical analyses are accessible through a menu system that contains several parameters:
- year
- type of analysis (and cause of death)
- geographical level (Belgium, by region, provinces or district)
- gender
You’ll have to select a parameter in each drop down menu. (The indication “— Make your selection —” should no longer appear.)
The statistical indicators available for the overall mortality are:
- number
- mortality rate (crude, age and/or sex standardized) and
- life expectancy;
Additional indicators for the specific cause of death based on the International Classification of Diseases (ICD) are:
- proportional mortality rate (PMR)
- potential years of life lost (PYLL) and
- effect of longevity.
The procedures of the perinatal statistics (national as well as international criteria) for the live births are:
- number
- proportion or rate by birth status (live births vs all births)
- multiple births
- birthweight
- pregnancy duration and
- delivery mode
Infant mortality statistics include:
- number
- proportion or rate by period of death
- birthweight
- pregnancy duration and
- delivery mode
Data
The Federal Public Service for Health, Food Chain Safety and Environment provided birth and mortality data for the period from 1987 to 1990. Since 1991, Statbel, the Belgian statistical office, has been providing these data together with population data dating back to 1987. Statbel centralises the mortality information registered by the Flemish and French Communities (International Classification of Disease-9 (ICD-9)). From 1998 onwards, ICD-10 is used. These data are grouped in SPMA by age, sex, nationality and district.
The mortality information is registered on the basis of residency (de jure information) instead of place of death (de facto information).
As far as mortality is concerned, only the initial cause of death is taken into account. The initial cause of death is defined in accordance with the encoding rules of the World Health Organization (WHO), as:
- the diseases or the injuries which are at the base of a reaction chain of morbidities that finally lead to death or
- the circumstances of the accident or the act of violence which have caused the fatal injury.
Output
Table
The results of a table can be exported to MS Excel:
- Select the output table (without the title) in the output window of your browser by pointing your cursor to the upper left cell of the table. Click once and drag it to the lower right cell of the table.
- Copy this selection by opening your browser’s Edit menu and choosing Copy from this menu — or alternatively, hold down the CTRL key and press C.
- Open MS Excel.
- Paste the selection in MS Excel by choosing: Edit — Paste (CTRL + V).
- We recommend pasting without choosing a table format: Format — Autoformat: none - ok
Or they can be exported to MS Word:
- Select a table (with or without title) in the output window of your browser by pointing the cursor to the upper left cell of the table. Click once and drag it to the lower right cell of the table.
- Copy this selection by opening your browser’s Edit menu and choosing Copy from it.
- Open MS Word.
- We recommend set your MS Word page layout to landscape format by opening the File-menu and selecting Page Setup — Paper size: landscape and clicking OK.
- Paste the selection in MS Word by choosing: Edit – Paste.
Map/graph
- You can copy, print or adapt the map or graph by clicking the right mouse button (left button for a left-handed mouse).
Warning
- We apply the Belgian numbering system, which uses a comma (,) as a decimal separator.
- The sum of the population of all age groups does not always equal the total population. This is because we use the midyear population, which is calculated as (popyear1 + popyear2)/2, and which may occasionally result in decimal numbers. The results are rounded off automatically to the unit above.
- The sum of the number of deaths of all age groups does not always equal the total number of deaths. This is due to the fact that not for each and every deceased person the age is known.
Acknowledgement
These data can be used freely on the sole condition that the source is mentioned as follows:
Standardized Procedures of Mortality Analysis. Sciensano, Brussels, Belgium; software available at https://spma.sciensano.be
Sciensano is not responsible for the conclusions drawn based on these data.
Statistical methods
Mortality
Proportional mortality ratio (PMR)
The PMR is the proportion of the number of deaths attributed to a specific cause and the total number of deaths, expressed in percentages. About 80% of the deaths in Belgium occur among elderly (65 years and older); the specific causes of death in this group have a decisive influence on the overall mortality. The study of the PMRs for all ages gives a good overview of the main causes of death among elderly, but also masks those causes that occur at a younger age. Therefore, the PMR was calculated for the following age groups: 1-14 years, 15-24 years, 25-44 years, 45-64 years and 65 years and older.
Standardisation
Age and sex are important factors when studying mortality statistics. To enable the comparison of mortality rates between the Belgian (geographical) regions, the data were standardised for age and/or sex, with the distribution of age of either the Belgian, the European (new or old) or the World population as reference groups. In order to compare districts, the mortality rates were standardised for sex and age, with as reference group the specific mortality rates by sex and age of either the Belgian, the Flemish, the Walloon or the Brussels population: indirect standardisation or SMR (Standardised Mortality Ratio). The number of observed deaths is calculated as compared to the number of expected deaths based on specific mortality rates by sex and age at national level. An SMR below 100 means that the number of observed deaths at the level of the district is smaller than what was expected when the national mortality rate was applied to the concerned district.
Potential years of life lost (PYLL)
This indicator is used to measure the importance of premature causes of death. The number of years lost before the age of 65 years, for example, as death occurs at age X, is calculated using the formula “65 — X”. Then, the total PYLL for a specific cause of death is divided by the number of exposed person years. “PYLL to LE” (Potential Years of Life Lost to Life Expectancy) means “PYLL to LE conditional to age” (rather than LE at birth). It represents the number of Potential Years of Life Lost (PYLL) between death and the Life Expectancy remaining at each age group. It is calculated as the sum of the age-specific PYLLs, over all age groups.
Life expectancy
The theoretical increase in the number of life years after 100% elimination of the mortality due to a specific cause of death is an indicator based on the comparison of two life expectancies at birth (summary life tables are used to calculate the life expectancy): one is (as usually) calculated from the risk of mortality by age group and the other is estimated after elimination of mortality by a specific cause of death (or a group of physiologically related causes). This leads to the assumption that the risk of death by this specific cause is independent of other causes of death.
Perinatality
The parameters “residence” and “nationality” refer to the mother.
Natality rate
The ratio of the number of live births in an area to the population of that area; expressed per 1000 population per year.
Age specific fertility rate
The ratio of the number of live births during a year to women in a particular age group, usually per 1000 women in an area.
Denominator
The denominator used to calculate the rates (infant mortality, preterm delivery,…) consists of the number of children born in Belgium in the corresponding years. For stillbirth and perinatal mortality rate the denominator is the sum of all children born alive and stillbirths. For the early neonatal mortality rate, the rates of death after the 7th day (late neonatal and postneonatal) and the infant mortality rate only live births are included in the denominator. The birthweight was not a criterion for including or excluding a child from the denominator. The potential effect of excluding children with a very low birthweight from the denominator was small given the low number of cases.
Confidence Interval (CI)
The 95% CI were calculated on the basis of the observed values. Several methods were applied according to the type of indicator (proportion, mortality rate) and the objectives of the analysis. The classical formula is based on a Binominal distribution (p = proportion in a geographical area, n = number of births in this area). This method was especially used for the CI of the proportions of preterm delivery and low birthweight, particularly from the comparison between provinces and between regions.
 For the analysis by district, and more specifically for the geographical presentation of the data, a method, proposed by Black and MacFarlane (Reference: Black N, MacFarlane A. Methodological kit: monitoring perinatal mortality statistics in a health district. Community Medicine 1982;4:25-33), was applied (P = proportion observed on national level, n = number of births in the district).
 Based on the CIs, the districts are classified in 4 groups to create a map:
- < CI: proportion in district is statistically significantly smaller than national proportion (p < CI);
- CI (≤ P): proportion in district is smaller, but not statistically different from national proportion (CI ≤ p ≤P);
- CI (> P): proportion in district is higher, but not statistically different from national proportion (P < p ≤ CI);
- > CI: proportion in district is statistically significantly higher than national proportion (CI < p).
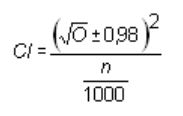
CIs for the different mortality rates (per 1000 births) were calculated according to the square root transformation using a Poisson distribution (O = number of cases in an area, number of births in this area).
 Box-and-Whisker plot
A Box-and-Whisker plot represents the distribution of the values observed in each district. This figure presents the dispersion between the 25th and the 75th percentile (Interquartile Range (IQR)) by a rectangle. The median (50th percentile) is the horizontal line in the rectangle. Certain values are considered as outside the dispersion, with a distinction between extreme values and outliers. Extreme values and outliers are minimum 3 and 1,5 times the IQR respectively. The vertical lines that start from these limits of the rectangle go to the minimum or maximum value, or in case of outliers, to the observation that is not an outlier.
Health expectancy
Health Expectancies express the number of remaining years spent in a specific state of health at a particular age assuming current rates of mortality and morbidity.
Health expectancies have been developed to assess whether or not a longer life also entails an increase in the time lived in good health (the compression of morbidity scenario) or in bad health (expansion of morbidity). So health expectancies divide life expectancy into life spent in different states of health. In this way they add a dimension of quality to the number of years (quantity of life) lived.
Health Expectancy is a general term that refers to an entire class of indicators. Since there are many dimensions of health, there are also many “health expectancies”. The most common health expectancies are those based on self-perceived health, activity limitation and chronic morbidity. The health expectancy indicator based on activity limitation is called the Healthy Life Years (HLY) indicator and is part of the European Structural Indicators. Here you will find Belgian data on health expectancies based on self-perceived health, activity limitation and chronic morbidity by gender, age and region.
These indicators are calculated using the Sullivan method. Mortality data for the years 1997, 2001, 2004 and 2008 were obtained from the DGSIE/ADSEI, and health status prevalence data were obtained from the 1997, 2001, 2004 and 2008 Health Interview Surveys.
Perinatal statistics
National vs. international criteria
Perinatal mortality rates can differ up to 50% depending on the definitions used to include a stillbirth. The criteria can be a minimum gestational age , a minimum birth weight, or a combination of both.
Previously, the World Health Organisation (WHO) — in the context of ICD9 – considered the birth weight as the first criteria to include a foetal death in the statistics: for national use, the WHO recommended to include in the perinatal statistics “… all live and death born children with a minimum birth weight of 500g, or if this information was unknown, those with a pregnancy duration of minimum 22 weeks.” For international use, the WHO recommended to include : “… all live and death born children with a minimum birth weight of 1000g, or if this information was unknown, those with a pregnancy duration of minimum 28 weeks “.
More recent definitions give priority to the gestational age as first criteria to register fetal deaths.
EURO-PERISTAT:
EURO-PERISTAT defines stillbirth as fetal death at or after 22 completed weeks of gestation.
Perinatal statistics for international use:
The definition of a stillbirth recommended by WHO for international comparison is a baby born with no signs of life at or after 28 weeks’ gestation.
In the SPMA we have adopted the following criteria:
- For national statistics: we report fetal deaths at or after 22 completed weeks of gestation, or if gestational age is unknown, a birth weight of at least 500g.
- For international statistics: we report fetal deaths at or after 28 completed weeks of gestation, or if gestational age unknown, a birth weight of at least 1000g.
The application of these different definitions does not affect the calculation of mortality rates with regard to later periods (neonatal, post-neonatal and infant mortality).
Period of death

Birth weight and preterm delivery
The following WHO definitions with regard to birth weight and pregnancy duration are considered:
- low birthweight: less than 2500 gram
- very low birthweight: less than 1500 gram
- preterm delivery: pregnancy duration of less than 37 weeks
- very preterm delivery: pregnancy duration of 32 weeks or less
Start your analyses
The statistics of the SPMA are classified in 5 main chapters. (The 6th one offers a link to the health expectancy tool.) Each chapter is subdivided in different modules. Clicking on a module will connect you with the interactive web page.
Population
Overall mortality
Cause-specific mortality
Perinatality (national criteria)
Perinatality (international criteria)
Health expectancy